CHCI participation at IEEE VIS and VDS 2022
September 26, 2022
Yalong Yang, Chris North, Rebecca Faust and Han Liu have papers at IEEE VIS 2022 and the Visualization in Data Science (VDS) Symposium at IEEE VIS, Oklahoma City, Oklahoma, October 16-21, 2022.
Yalong Yang is a co-author of three papers that will be presented at IEEE VIS, including "The Quest for Omnioculars" which received a Best Paper Honorable Mention Award from IEEE VIS – Congratulations Yalong!
IEEE VIS is the premier forum for advances in visualization and visual analytics. VIS 2022 is the year’s premier forum for advances in theory, methods, and applications of visualization and visual analytics. The conference convenes an international community of researchers and practitioners from academia, government, and industry to exchange recent findings on the design and use of visualization tools.
In their paper "The Quest for Omnioculars", Yang and co-authors Tica Lin (the leading author), Zhutian Chen, Daniele Chiappalupi, Johanna Beyer, and Hanspeter Pfister, present a user-centered design study of interactive embedded visualizations for basketball fans to improve their live game-watching experience.
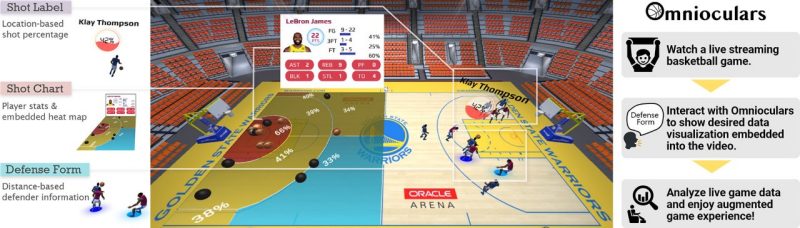
Abstract: Sports game data is becoming increasingly complex, often consisting of multivariate data such as player performance stats, historical team records, and athletes’ positional tracking information. While numerous visual analytics systems have been developed for sports analysts to derive insights, few tools target fans to improve their understanding and engagement of sports data during live games. By presenting extra data in the actual game views, embedded visualization has the potential to enhance fans’ game-viewing experience. However, little is known about how to design such kinds of visualizations embedded into live games. In this work, the researchers present a user-centered design study of developing interactive embedded visualizations for basketball fans to improve their live game-watching experiences. Researchers evaluated Omnioculars in a simulated basketball game with basketball fans. The study results suggest that our design supports personalized in-game data analysis and enhances game understanding and engagement.
The other two papers are journal papers that were invited for presentation at VIS 2022:
Tica Lin, Yalong Yang, Johanna Beyer, Hanspeter Pfister. Labeling Out-of-View Objects in Immersive Analytics to Support Situated Visual Searching.
Published in: IEEE Transactions on Visualization and Computer Graphics
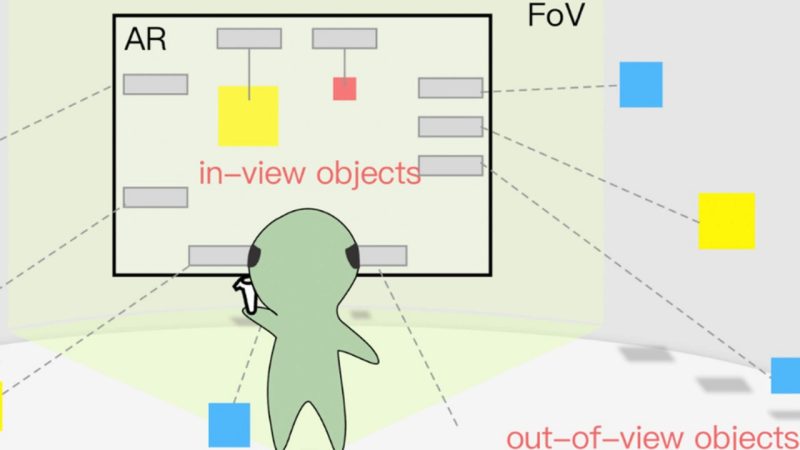
Abstract: This paper identifies and categorizes different design aspects in AR label design and reports on a formal user study on labels for out-of-view objects to support visual search tasks in AR. Three three visualization techniques are designed for out-of-view object labeling in AR, which respectively encode the relative physical position (height-encoded), the rotational direction (angle-encoded), and the label values (value-encoded) of the objects. Further, there are implementations of two traditional in-view object labeling techniques, where labels are placed either next to the respective objects (situated) or at the edge of the AR Field of View (FOV) boundary. The researchers evaluate these value-encoded different label conditions in three visual search tasks for static objects. This study shows that out-of-view object labels are beneficial when searching for objects outside the FoV, spatial orientation, and when comparing multiple spatially sparse objects. Angle-encoded labels with directional cues of the surrounding objects have the overall best performance with the highest user satisfaction. The researchers discuss the implications of their findings for future immersive AR interface design.
Johanna Beyer, Yalong Yang, Hanspeter Pfister. Visualization Design Sprints for Online and On-Campus Courses.
Published in: IEEE Computer Graphics and Applications
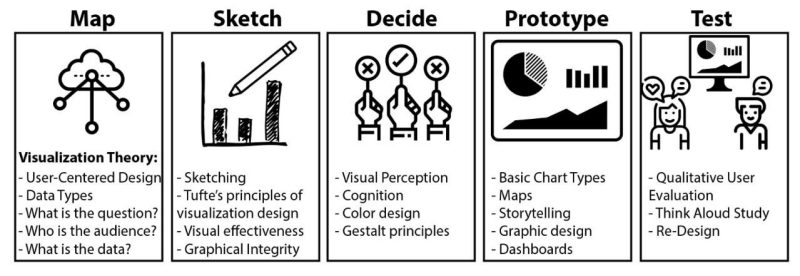
Abstract: This paper presents how to integrate Design Sprints and project-based learning into introductory visualization courses. The well-defined, interactive, and time-constrained design cycle makes design sprints a promising option for teaching project-based and active-learning-centered courses in order to increase student engagement and hands-on experience. Design sprint is a methodology to accelerate and simplify the design process. The researchers present a detailed guide on incorporating design sprints into large undergraduate and small professional development courses in both online and on-campus settings. Design sprint results, including quantitative and qualitative student feedback, show that design sprints engage students and help practice and apply visualization and design skills. This paper also provides design sprint teaching materials, shows examples of student-created work, and discusses limitations and lessons learned.
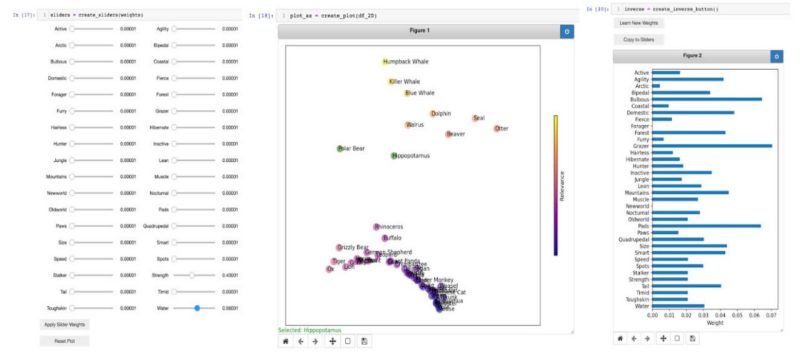
Han Liu and Chris North. Case Study Comparison of Computational Notebook Platforms for Interactive Visual Analytics.

Abstract: The way of using computational notebooks is quite different between data science and visual analytics. Data scientists focus on data exploration with the code, while visual analytics users are interested in engaging with interactive visual interfaces to facilitate analytical reasoning. Such a difference leads to design contradictions while merging visual analytics tools with data science tools in computational notebooks. In this work, we investigated the problem using an example called “Andromeda,” which is an interactive dimension reduction algorithm, and implemented it using three different notebook platforms: 1) Python code in a Jupyter Notebook, 2) JavaScript code in an Observable Notebook, and 3) embedding both Python (data science use) and JavaScript (visual analytics use) in a Jupyter Notebook. Advantages and disadvantages are concluded for each platform by making comparisons based on various aspects, such as design logic, coding differences, performance, and usability. Laying the groundwork for data scientists, advice and recommendations are made on architecting similar notebooks and which platform to choose in various situations.
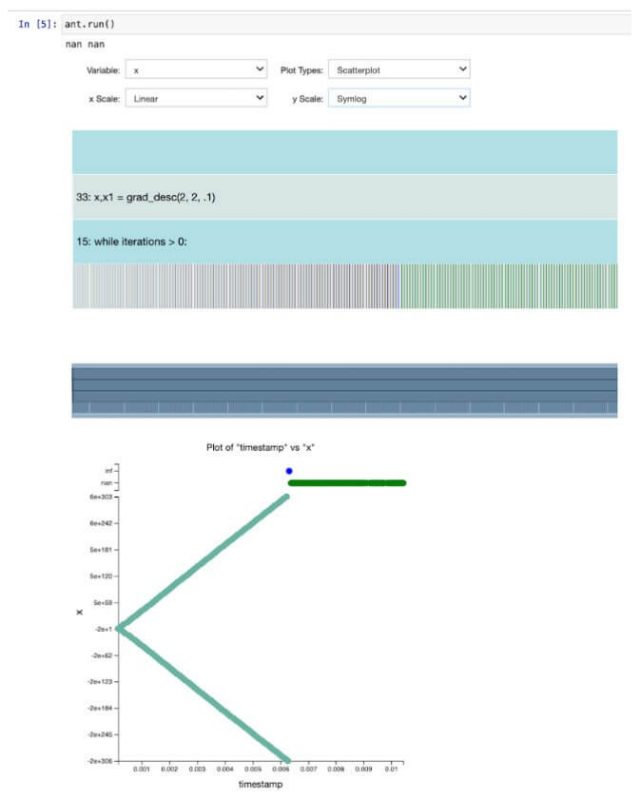
Rebecca Faust, Carlos Scheidegger, Katherine Isaacs, William Z. Bernstein, Michael Sharp, and Chris North. Interactive Visualization for Data Science Scripts.

Abstract: As the field of data science continues to grow, so does the need for adequate tools to understand and debug data science scripts. Current debugging practices fall short when applied to a data science setting, due to the exploratory and iterative nature of analysis scripts. Additionally, computational notebooks, the preferred scripting environment of many data scientists, present additional challenges to understanding and debugging workflows, including the non-linear execution of code snippets. This paper presents Anteater, a trace-based visual debugging method for data science scripts. Anteater automatically traces and visualizes execution data with minimal analyst input. The visualizations illustrate execution and value behaviors that aid in understanding the results of analysis scripts. To maximize the number of workflows supported, we present prototype implementations in both Python and Jupyter. Last, to demonstrate Anteater’s support for analysis understanding tasks, we provide two usage scenarios on real world analysis scripts.
Related Content
-
General Item