CHCI Contributions to CHI 2023
April 10, 2023
Multiple CHCI faculty and students are contributing research and workshop papers and demos to CHI this year, including Sang Won Lee, Yan Chen, Vikram Mohanty, Feiyu Lu, Md Momen Bhuiyan, Uma Gunturi, Eugenia H. Rho and (VT/CS/CHCI alum) Tanushree Mitra.
The ACM CHI Conference on Human Factors in Computing Systems is the premier international conference of Human-Computer Interaction (HCI). CHI – pronounced ‘kai’ – annually brings together researchers and practitioners from all over the world and from diverse cultures, backgrounds, and positionalities, who have as an overarching goal to make the world a better place with interactive digital technologies. CHI 2023 (April 23-28) is taking place in Hamburg, Germany at the Congress Center Hamburg (CCH).
Research Papers
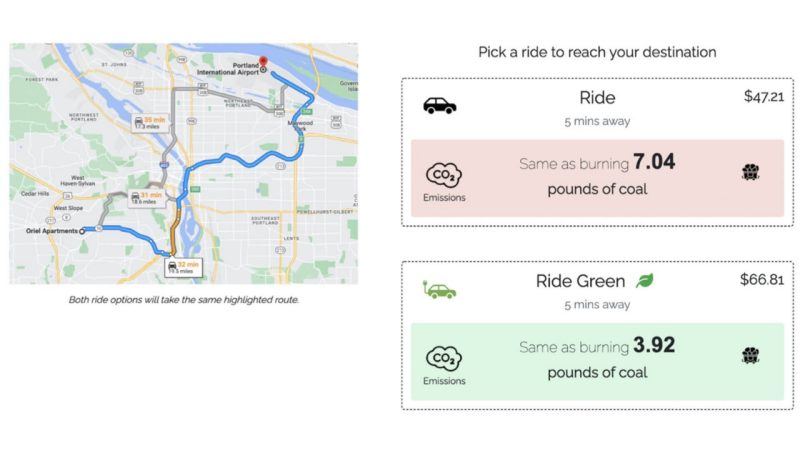
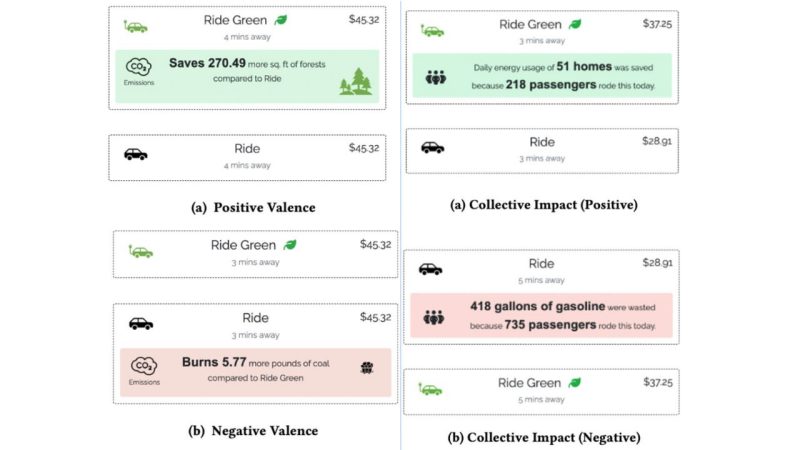
Save A Tree or 6 kg of CO2? Understanding Effective Carbon Footprint Interventions for Eco-Friendly Vehicular Choices (Honorable Mention)
Vikram Mohanty; Alexandre L. S. Filipowicz; Nayeli Suseth Bravo; Scott Carter; David A. Shamma
From ride-hailing to car rentals, consumers are often presented with eco-friendly options. Beyond highlighting a "green" vehicle and CO2 emissions, CO2 equivalencies have been designed to provide understandable amounts; we ask which equivalencies will lead to eco-friendly decisions. We conducted five ride-hailing scenario surveys where participants picked between regular and eco-friendly options, testing equivalencies, social features, and valence-based interventions. Further, we tested a car-rental embodiment to gauge how an individual (needing a car for several days) might behave versus the immediate ride-hailing context. We find that participants are more likely to choose green rides when presented with additional information about emissions; CO2 by weight was found to be the most effective. Further, we found that information framing - be it individual or collective footprint, positive or negative valence - had an impact on participants’ choices. Finally, we discuss how our findings inform the design of effective interventions for reducing car-based carbon-emissions.
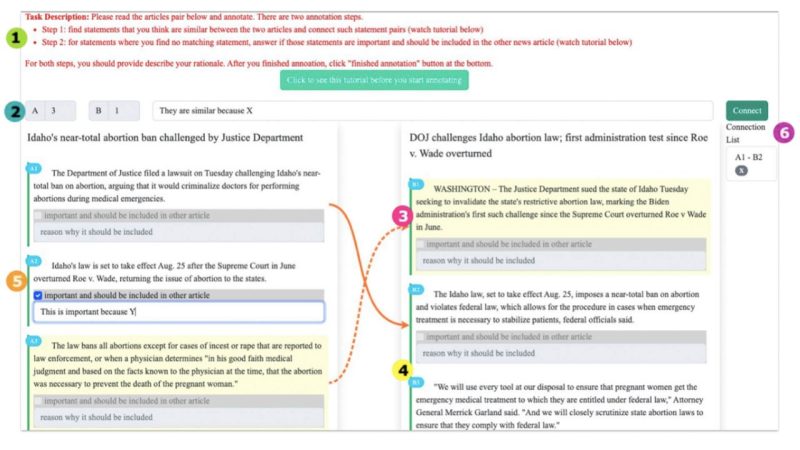
NewsComp: Facilitating Diverse News Reading through Comparative Annotation
Md Momen Bhuiyan, Sang Won Lee, Nitesh Goyal, Tanushree Mitra
To support efficient, balanced news consumption, merging articles from diverse sources into one, potentially through crowdsourcing, could alleviate some hurdles. However, the merging process could also impact annotators' attitudes towards the content. To test this theory, we propose comparative news annotation; that is, annotating similarities and differences between a pair of articles. By developing and deploying NewsComp---a prototype system---we conducted a between-subjects experiment (N=109) to examine how users' annotations compare to experts', and how comparative annotation affects users' perceptions of article credibility and quality. We found that comparative annotation can marginally impact users' credibility perceptions in certain cases; it did not impact perceptions of quality. While users' annotations were not on par with experts', they showed greater precision in finding similarities than in identifying disparate important statements. The comparison process also led users to notice differences in information placement and depth, degree of factuality/opinion, and empathetic/inflammatory language use. We discuss implications for the design of future comparative annotation tasks.
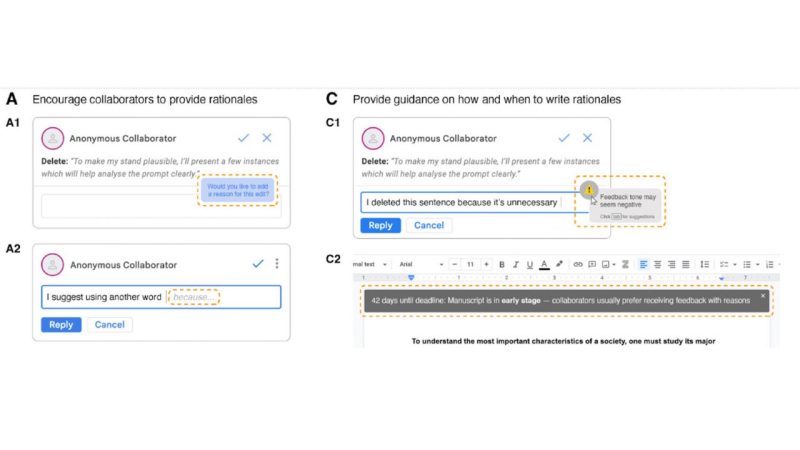
Why "why"? The Importance of Communicating Rationales for Edits in Collaborative Writing
So Yeon Park, Sang Won Lee
Collaborative writing is prevalent, yet is rife with issues of discomfort and miscommunication among others despite access to limitless text. Editing, one key activity in collaborative writing, is prone to such issues, and providing rationales could be a promising solution. To understand the efficacy of rationales in this context, we conducted an online experiment pairing 40 participants to co-write two essays on Google Docs—one without rationales (control) and another with rationales (treatment)—followed by post-experiment surveys (N=40) and interviews (N=11) with participants who received edits with and without rationales. Despite no significant differences between conditions in survey results, interviews revealed that most people preferred collaborating with those who provided rationales and perceived them more favorably. All interviewees deemed rationales important in collaborative writing and felt the pros outweigh the cons. We contribute design recommendations with illustrative examples for effective collaborative writing.
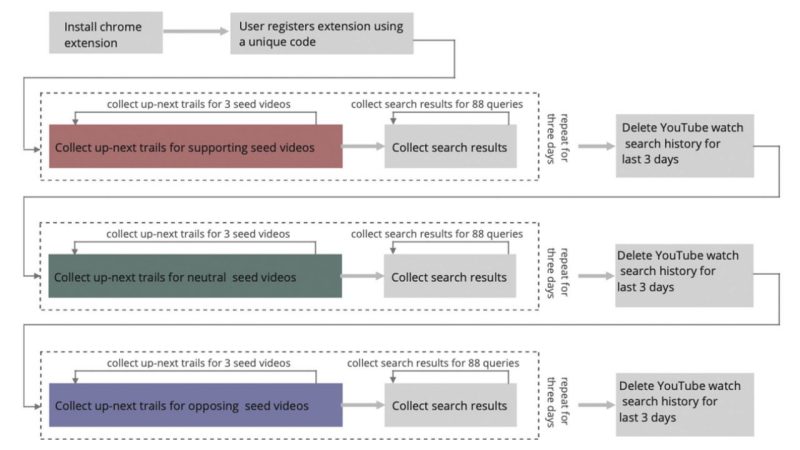
Assessing enactment of content regulation policies: A post hoc crowd-sourced audit of election misinformation on YouTube
Prerna Juneja, Md Momen Bhuiyan, Tanushree Mitra
With the 2022 US midterm elections approaching, conspiratorial claims about the 2020 presidential elections continue to threaten users' trust in the electoral process. To regulate election misinformation, YouTube introduced policies to remove such content from its searches and recommendations. In this paper, we conduct a 9-day crowd-sourced audit on YouTube to assess the extent of enactment of such policies. We recruited 99 users who installed a browser extension that enabled us to collect up-next recommendation trails and search results for 45 videos and 88 search queries about the 2020 elections. We find that YouTube's search results, irrespective of search query bias, contain more videos that oppose rather than support election misinformation. However, watching misinformative election videos still lead users to a small number of misinformative videos in the up-next trails. Our results imply that while YouTube largely seems successful in regulating election misinformation, there is still room for improvement.
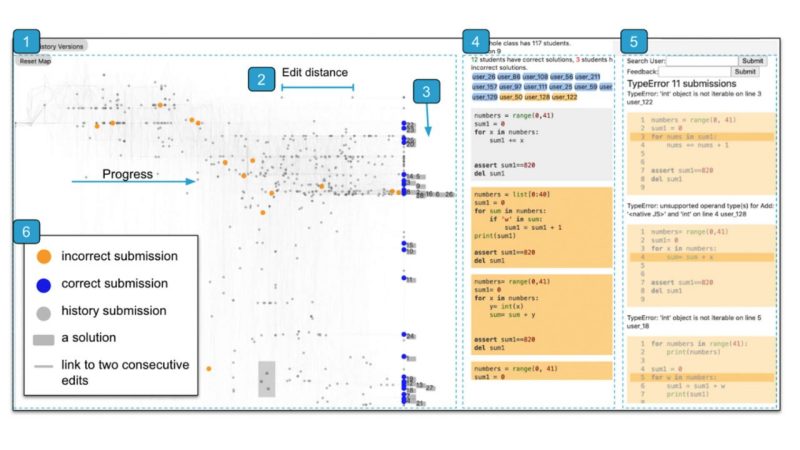
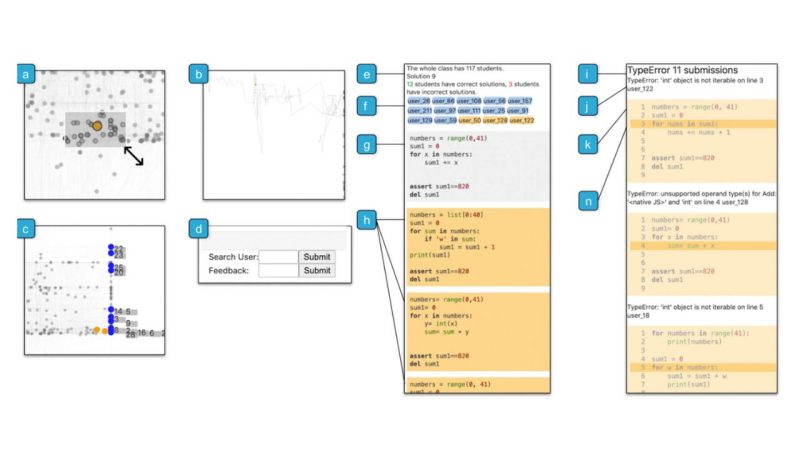
VizProg: Identifying Misunderstandings by Visualizing Students' Coding Progress (Honorable Mention)
Ashley Ge Zhang, Yan Chen, Steve Oney
Programming instructors often conduct in-class exercises to help them identify students that are falling behind and surface students' misconceptions. However, as we found in interviews with programming instructors, monitoring students' progress during exercises is difficult, particularly for large classes. We present VizProg, a system that allows instructors to monitor and inspect students' coding progress in real-time during in-class exercises. VizProg represents students' statuses as a 2D Euclidean spatial map that encodes the students' problem-solving approaches and progress in real-time. VizProg allows instructors to navigate the temporal and structural evolution of students' code, understand relationships between code, and determine when to provide feedback. A comparison experiment showed that VizProg helped to identify more students' problems than a baseline system. VizProg also provides richer and more comprehensive information for identifying important student behavior. By managing students' activities at scale, this work presents a new paradigm for improving the quality of live learning.
Workshop Papers
Eugenia Rho and several of her students contributed papers to the workshop on harassment in online spaces.
Workshop: Combating Toxicity, Harassment, and Abuse in Online Social Spaces

This workshop brings together researchers from various backgrounds to build a community, identify current challenges, imagine potential solutions, and foster collaborations aiming to help combat online toxicity, hate, and harassment. Online social spaces provide much needed connection and belonging—particularly in a context of continued lack of global mobility due to the ongoing Covid-19 pandemic and climate crisis. However, the norms of online social spaces can create environments in which toxic behavior is normalized, tolerated or even celebrated. This can occur without consequence, leaving its members vulnerable to hate, harassment, and abuse. A vast majority of adults have experienced toxicity online and the harm is even more prevalent for members of marginalized and minoritized groups, who are more often the targets of online abuse.
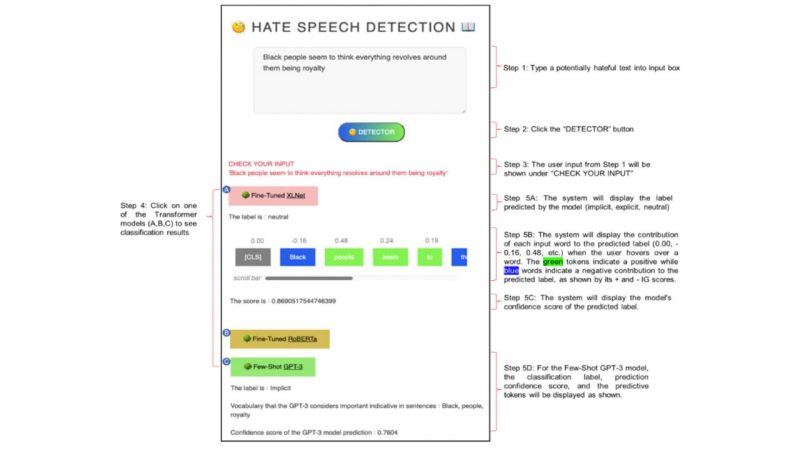
ToxVis: Enabling Interpretability of Implicit vs. Explicit Toxicity Detection Models with Interactive Visualization
Uma Gunturi, Xiaohan Ding, Eugenia H. Rho
People’s judgment of hateful online content is inherently subjective and multi-faceted as interpretations around what is and is not hateful can depend on personal values, social identities, and culture. Hence, as opposed to explicit hate-speech or profanity-laden attacks where the offender’s mal intent is expressed in black and white language, it is more challenging to effectively respond to, or mitigate harms caused by implicit hate speech. This is because implicit toxicity often takes the form of humor, insider expressions, neologisms, and microaggressions, (e.g. "Black people seem to think everything revolves around them being royalty" (from r/unpopularopinion). Hence, human moderators and content moderation systems have difficulty understanding, recognizing, and responding to implicit hate speech, resulting in moderation failures where false negatives (harmful, yet undetected texts) are left unmoderated.
Furthermore, most hate-classification research, including studies that examine implicit hate speech, often use black-box deep learning (DL) models that lack interpretability, thereby failing to explain why a content was classified as hateful. In this work, we aim to address these challenges by developing a visually interactive and explainable tool called ToxVis.
We built ToxVis by using RoBERTa, XLNET, and GPT-3 and fine-tuning two transformer-based models to classify hate speech into three categories of hate speech: implicit, explicit, and non-hateful. We then used DL interpretation techniques to make the classification results explainable. Through ToxVis, users can (step 1 in figure below) type in a potentially hateful text into the system. The system will then (step 2) classify the input text into one of the three categories of hate speech (implicit, explicit, or non-hateful). The user can then click on the classification results (step 3) to see which words from the input text contributed most to the classification decision, as the model’s prediction confidence score.
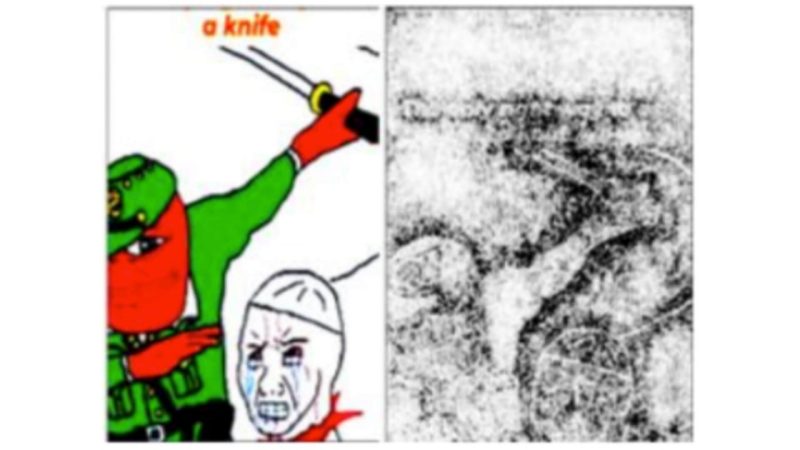
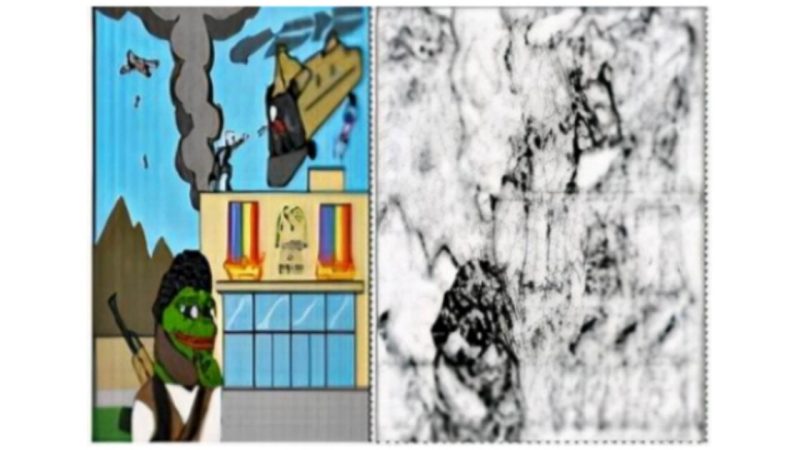
Real Memes In-The-Wild: Explainable Classification of Hateful vs. Non-Hateful Memes
Rohan Singh Leekha and Eugenia H. Rho
PDF of the paper
Functioning as visual punch-lines embedded with humor and satire, memes have become a mainstay of online public discourse. Memes function as “units of cultural transmission” and can quickly spread or reinforce ideas across online communities. Recent studies have shown that people sometimes use memes to disseminate violent, hateful, and misogynistic messages disguised as humor. The virality of such harmful memes over the recent years has encouraged deep learning (DL) research on hateful meme classification. These DL models however, are exclusively trained to classify memes based on synthetically generated data.
Synthetically generated meme data, such as the widely used Hateful Memes Challenge dataset from Meta AI was created by interchanging random texts with random images. Such artificially generated memes often exclude neologisms, insider- expressions, slangs and other linguistic nuances, which are prevalent across real memes that actually circulate online. As a result, current state-of-the-art classifiers perform poorly when tasked to predict real hateful memes.
Furthermore, such studies tend to focus solely on the prediction task rather than explaining the characteristics that make memes hateful – that is, classification results typically lack any explanation as to why a meme is predicted as hateful. We aim to address these gaps. First, we share a manually curated in-the-wild hateful meme dataset, RealMemes (3,142 memes) collected from Instagram, Reddit, and WhatsApp and Telegram groups. Unlike collecting textual data, compiling a meme dataset is particularly challenging as the overlaid text on a visual image makes searching through keywords difficult. Second, we make hateful meme classification results explainable by building an interpretable multimodal classification system that not only classifies hateful vs. non-hateful memes, but also identifies key words and visual descriptors associated with hateful vs. non-hateful memes.